Diversity
Diversity
Diversity in our curation
We keep the following statistics to evaluate the diversity of our curation. It should make visible where we have to take measures to increase this diversity. We examine the diversity of the artists of the productions that we saw throughout the year as well as those that we finally invited to our festival. The evaluation is based on six categories (see below).
We are aware that there are two problems with the categories: 1) The choice of the categories was made by us. On one hand because we consider these categories to be relevant and on the other hand because they seem manageable to us. 2) The chosen categories relate partly to identities which are ascribed to individual persons through self-identification. The external attribution of these identities through us sometimes remains speculation. The numbers could therefore be slightly inaccurate.
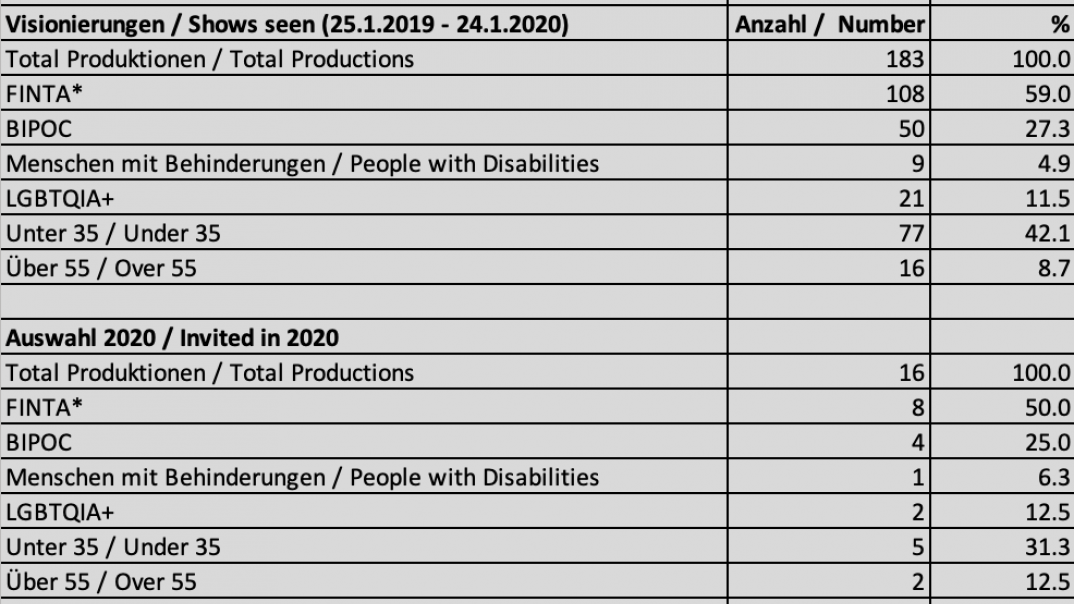
The statistics include productions that we saw from 25th January 2019 to 24th January 2020, which corresponds to a programming year of auawirleben. We saw a total of 183 productions during this period, and we invited 16 to auawirleben 2020. In all categories, the percentage of productions viewed roughly corresponds to the percentage of productions invited. This supports our assumption that it’s important to already keep the diversity high in the process of assessment in order to achieve a diverse programme.
We are fully aware that the work is not done by gathering the numbers. The data is of a purely informative nature. It can’t increase the diversity of our programme for us. What we can say for certain, though, is that we want a programme which is as diverse as our society is.
FINTA* (This is a term used in German speaking countries to refer to female, intersexual, non-binary, trans and agender persons. As the acronym works just as well in English, we’ll use it here.)
Criteria: At least 50% of the artistic directors are FINTA* people, or FINTA* topics are a central component on stage.
This applies to 108 (59%) of the productions seen and 8 (50%) of the invited productions.
In this category, 50% is the minimum of what we’d like to achieve. Even if in general FINTA* people are well represented in the festival (including the side-programme, team, etc.), we would prefer a higher proportion in the main programme. The number of assessed productions by FINTA* people should be increased.
BIPOC (Black, Indigenous and People of Colour)
Criteria: At least 50% of the artistic directors are BIPOC, or at least one BIPOC has a leading role on stage, or 30% of the people on stage are BIPOC. The statistics do not include productions in which individual BIPOC can merely be seen in supporting roles or in functions with little decision-making authority.
The criteria apply to 50 (27%) of the productions seen and 4 (25%) of the invited productions.
In our opinion, this proportion should be higher. To ensure this, we will increase the share of assessed productions for which the BIPOC criteria apply.
People with disabilities
Criteria: At least 50% of the artistic directors are people with a visible or known disability, or at least one person with a visible disability is on stage, or disability is a central theme of the show.
This applies to 9 (5%) of the productions seen and 1 (6%) of the invited productions.
The small share of 5% of the assessed productions unfortunately corresponds to the reality of the scene. Hence, it is not easy to increase this proportion substantially. We therefore want to increasingly support projects by artists with disabilities directly in their development. We will do this, for example, by co-producing projects or by inviting them based on submitted concepts and personal discussions instead of only after seeing the finished shows.
LGBTQIA+
Criteria: at least 50% of the artistic directors are openly communicated LGBTQIA+, or LGBTQIA+ topics are a central component on stage. Productions by people who are LGBTQIA+, but who do not address this in their work or otherwise publicly, are not counted in our statistics.
The criteria apply to 21 (12%) of the productions seen and 2 (13%) of the invited productions.
Both the percentages of assessed and invited productions seem small. This may be due to our criteria. Of course, we have (knowingly and unknowingly) seen many more productions by LGBTQIA+ people than appear in the statistics. How should this category be dealt with? Would the criteria have to be formulated differently in order to get more meaningful data? How can this be formulated and evaluated without having to ask the artists about their sexuality?
People under 35
Criteria: At least 50% of the artistic directors are under 35 years old, or at least one person under 35 has a leading role on stage, or at least 30% of the people on stage are under 35. Of some individual artist we couldn’t find out the age through research, therefore they do not appear in the statistics. However, the number seemed negligible to us.
The criteria apply to 77 (42%) of the productions seen and 5 (31%) of the invited productions.
With a difference of 11%, the proportion of invited productions differs the most from the assessed ones. However, we consider the share of 31% of the invited productions to be acceptable. It is important to us to give young artists opportunities and to show young perspectives in the festival. However, it is also important to us to be able to offer the not so young artists continuity in their work. We consider it essential to keep an eye on this balance. But should even collect data in this category? What conclusions can we actually draw from these numbers?
People over 55
Criteria: At least 50% of the artistic directors are over 55 years old, or at least one person over 55 has a leading role on stage, or at least 30% of the people on stage are over 55. Of some individual artist we couldn’t find out the age through research, therefore they do not appear in the statistics. However, the number seemed negligible to us.
The criteria apply to 16 (9%) of the productions seen and 2 (13%) of the invited productions.
The shares of both the assessed and invited productions are surprisingly small. Although we are not artistically interested in some of the “dinosaurs” of the scene, we consider it important to offer continuity to artists who have been in the business for a long time and are far from being “the next hot shit”. In particular, the intersectional group of FINTA* people over 55 is not represented enough in our programme. Does it make sense to collect date in this category?
Open questions
This statistic is work-in-progress. Collecting the numbers helps us because, despite their inaccuracy, they provide a basis for discussion and can be considered a steering tool. But there are still a lot of open questions:
How do we deal with the problem that for some categories we would need to know more about individuals than we do? Is it legitimate for us to assign some of the categories?
Should we define a minimum quota for each category? How high would it be in which category and why?
Intersectionality is not directly examined in statistics. How should and could it be evaluated?
Are certain categories missing? Are certain categories redundant?
Is this the right type of evaluation or is there a better method?